

Ryan Financial Intelligence System · Streamlit
首次接入Streamlit页面,可能会收到提示“This app has gone to sleep due to inactivity. Would you like to wake it back up?”
点击”Yes, get this app back up!”即可加载,该报告为Demo版,version 2026.05.23 v01,目前分为3个区间,列示损益、现金流桑基图(Sankey Diagram),资产负债表,以及综合收益表。原始数据为个人序时账JE,金额经过缩放、删减,以及脱敏,网页版非实际个人真实财务情况。
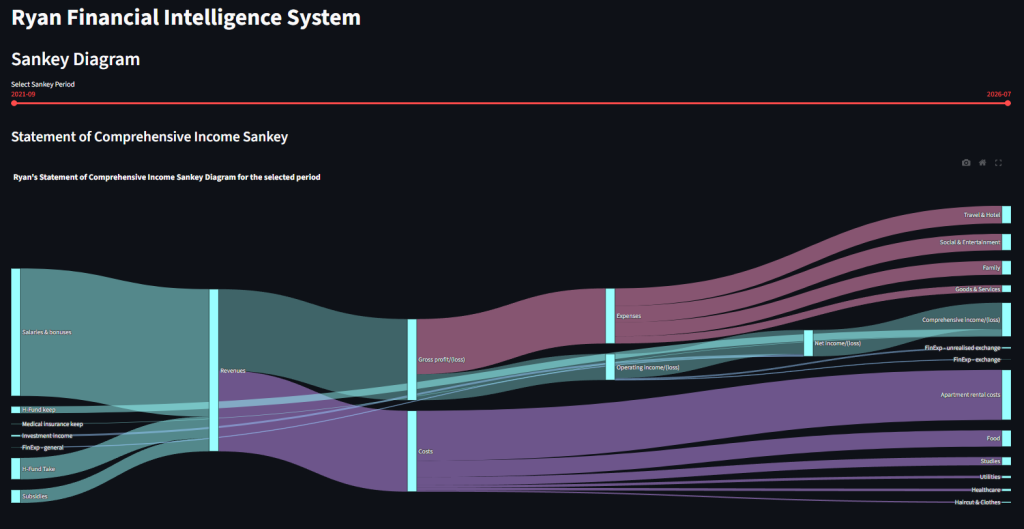
我赋予了序时账如下几层Mapping映射关系:
1.对应FSLI(Financial Statements Line Item);
2.对应账户属性(Account Property)划分流动-非流动资产、负债,权益;
3.资产负债表账户修正(将损益科目标记为留存收益取累计值);
4.损益表分区(Revenues,Costs,Expenses,Others,OCI);
5.资产负债表分区;
6.报表科目排序。
随后,通过累计、加减扣除等设定规则,基于Python Code生成互动式报表。
基本工作结构:
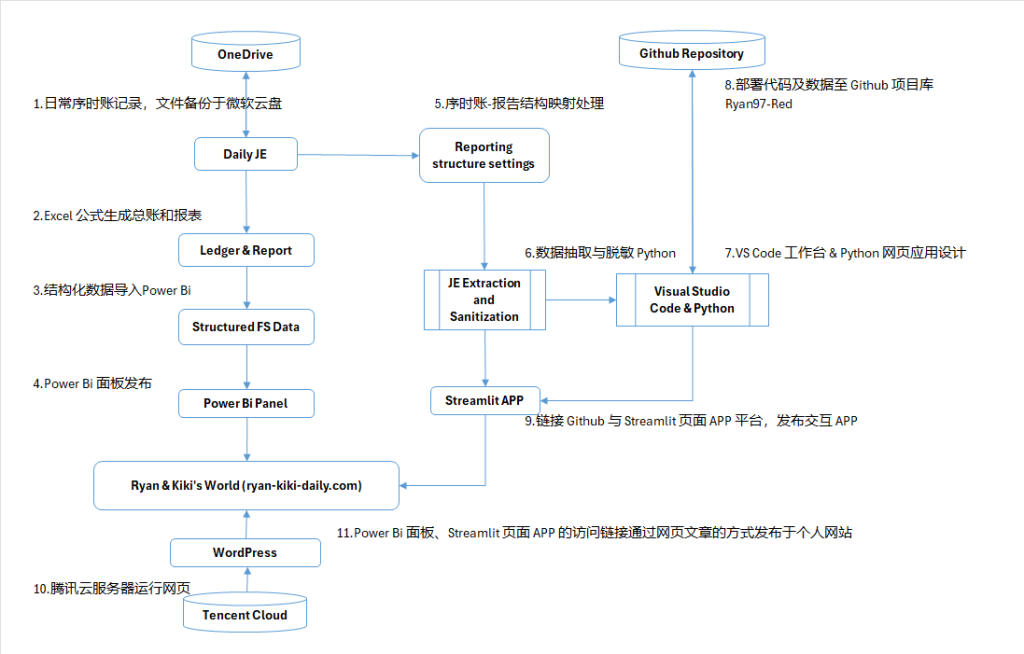
整体仍在开发调试中,还望读者您喜欢~!
——Ryan, 2026.05.23